Scripted Trading
Supply and Demand Zones (ThinkOrSwim)
Supply and Demand Zones (ThinkOrSwim)
Couldn't load pickup availability
****** LIMITATIONS ******
1 instance of the indicator plots 1 supply zone and 1 demand zone (Use multiple instances of the indicator with different user inputs to get more zones)
The indicator will start at the most recent bar and look back until it finds a zone that matches the user inputs (To force it to look farther you can increase the "Intensity" user input)
****** NO REFUNDS ******
ToS scripts are non-refundable. Please make an informed decision before purchasing.
****** ****** ****** ******
This indicator is intended for traders who already are knowledgeable about supply and demand trading. The intent of the script is to partially automate zone detection and drawing.
This indicator will automatically chart a supply and a demand zone made from recent price action that matches the criteria set in the User Inputs screen.
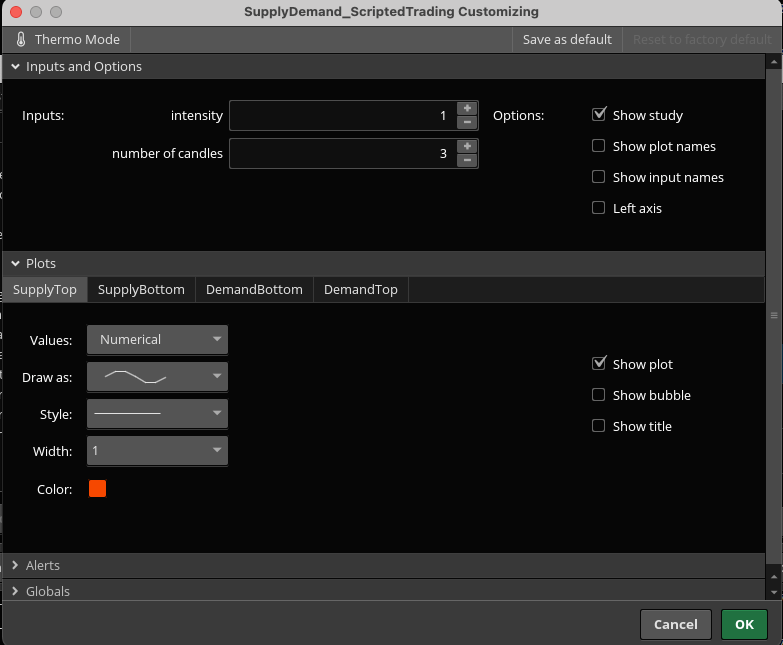
The indicator user inputs allow you to set the "Intensity" and "Number of Candles" variables.
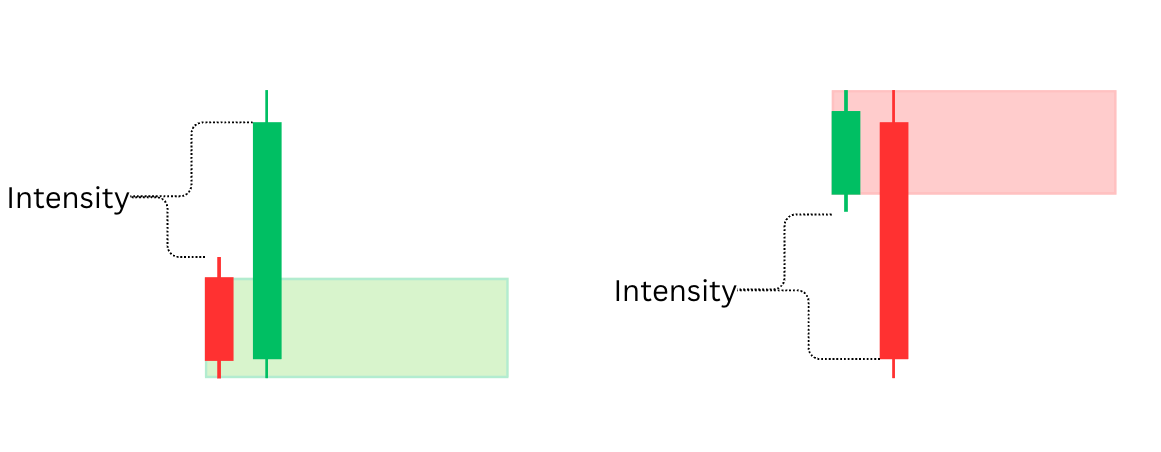
"Intensity" adjusts the relative distance that a drop or rally needs to cover in order to qualify as a zone.
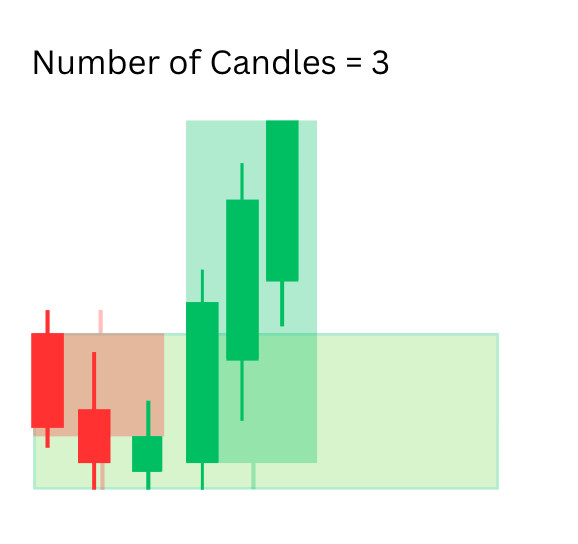
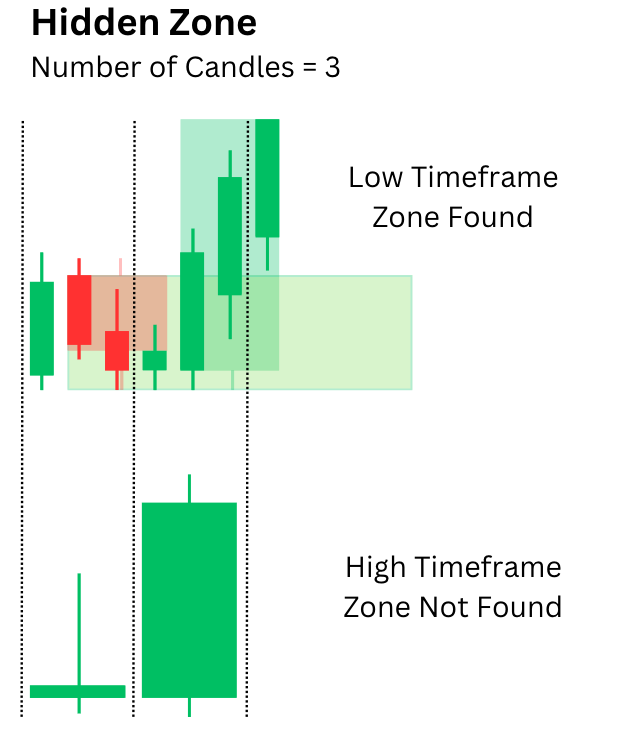
"Number of Candles" allows zones from higher timeframes and hidden zones to be drawn. i.e. On a 5min chart if the "Number of Candles" is set to 3 it will draw zones from the 15min timeframe. (5min x 3 candles = 15min)
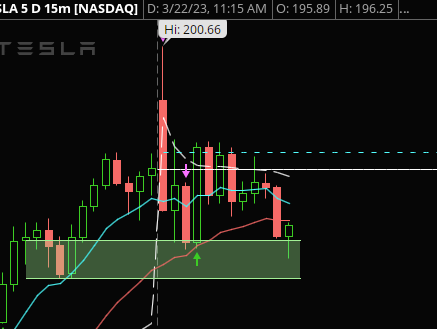
The first image shows a TSLA 15min chart with the indicator set to "Number of Candles" = 4. This charts a 1hr zone on the 15m chart. (15min x 4 candles = 1hr)
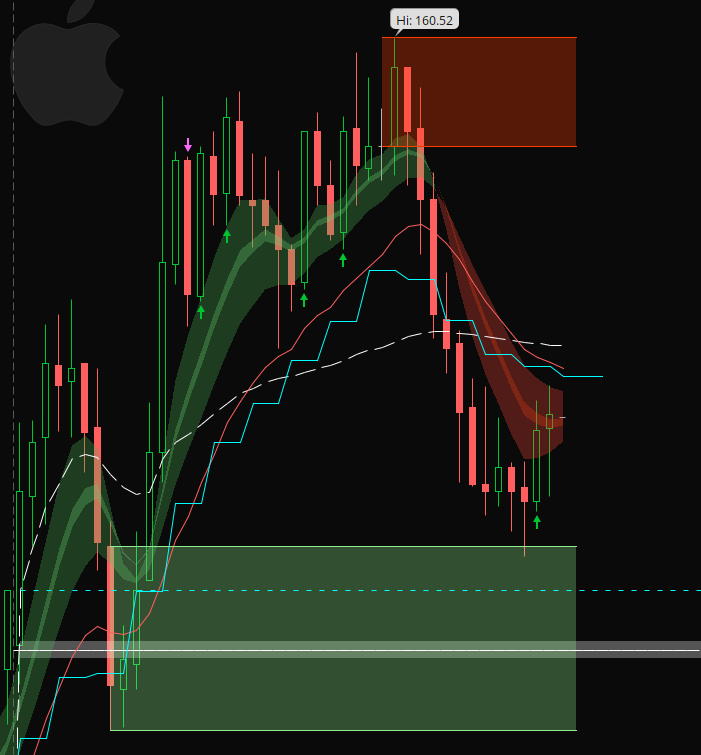
The second image shows an AAPL 5m chart with the indicator set to "Number of Candles" = 3. This charts 15min zones. (5min x 3 candles = 15min)
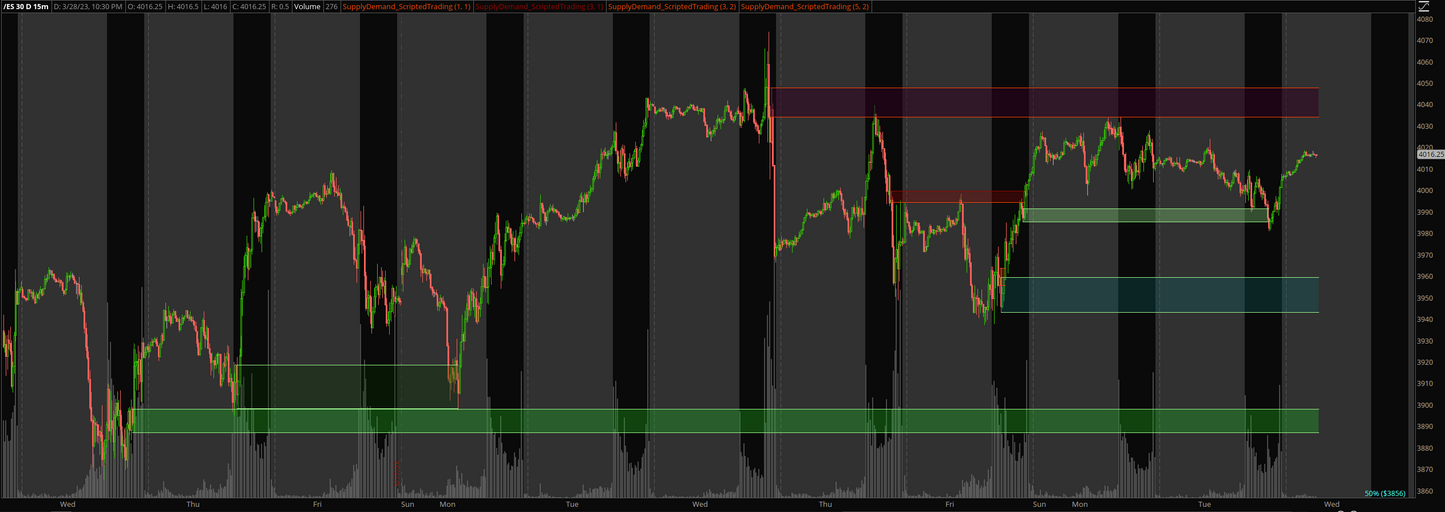
The fourth image shows an ES chart with the indicator added 4 times each time with different user inputs.
This methodology also allows the discovery of hidden zones that can not be found directly from the higher timeframe chart. See the diagrams to understand "Intensity", "Number of Candles", and "Hidden Zones"
KNOW WHAT YOU'RE BUYING BEFORE YOU BUY
