Scripted Trading
Multi-Time Frame Moving Averages
Multi-Time Frame Moving Averages
Couldn't load pickup availability
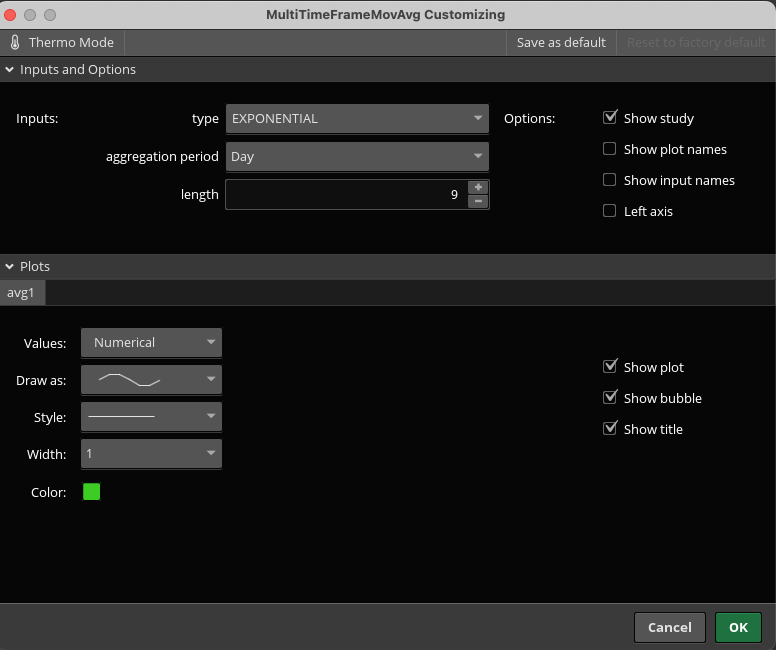
This study/indicator allows you to add simple moving averages and exponential moving averages from timeframes that differ from your chart's timeframe.
For example, if you are viewing a 5 min chart you can add EMAs from the 15 min, hourly, and/or daily timeframe. Other timeframes also available.
ThinkOrSwim already has a study that supports this function for simple moving averages. However, it is missing the important exponential moving average.
This study supports simple, exponential, weighted, wilders, and hull averages.
-------------------------
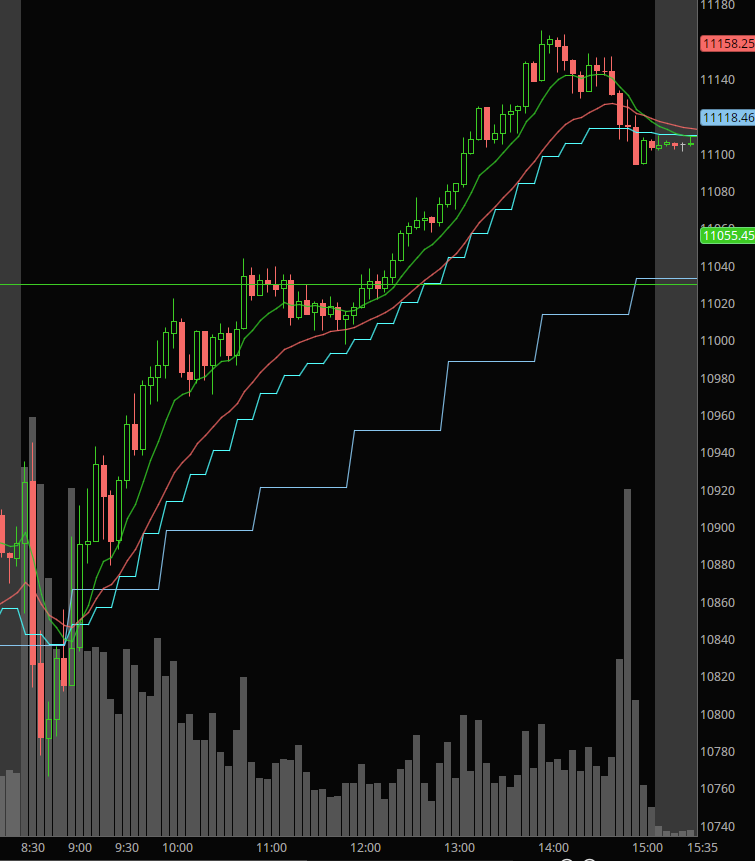
EMAs displayed in image:
9 ema from daily timeframe (straight green line)
9 ema from hourly timeframe (stair step dark blue line)
9 ema from 15 min timeframe (jagged light blue line)
9 and 20 ema from 5 min timeframe (green and red smooth lines)


